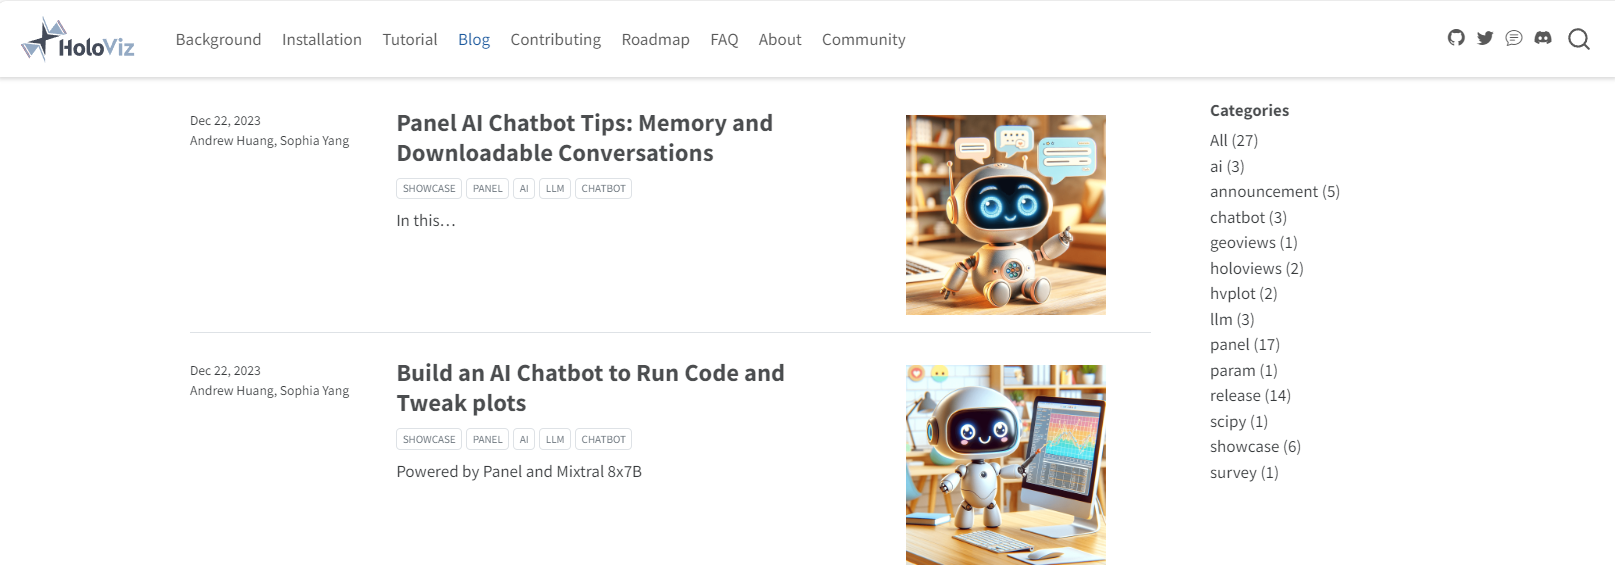
The purpose of this project is to make it easy to use the HoloViz ecosystem with Quarto.
Embed the HoloViz Ecosystem
With HoloViz you get access to a large ecosystem of tools for data visualization.
Code
import panel as pnimport pandas as pdpn.extension(design="material")gis_1880 ='https://earthobservatory.nasa.gov/ContentWOC/images/globaltemp/global_gis_1945-1949.png'gis_2015 ='https://earthobservatory.nasa.gov/ContentWOC/images/globaltemp/global_gis_2015-2019.png'swipe = pn.Swipe(gis_1880, gis_2015, height=450, sizing_mode="stretch_width")pn.Column( pn.chat.ChatMessage("Visualize the global temperature 1945-1949 against 2015-2019", user="User"), pn.chat.ChatMessage(swipe, user="Assistant"),)
---format: html---# HoloViz-QuartoThe purpose of this project is to **make it easy to use the [HoloViz](https://holoviz.org/) ecosystem with [Quarto](https://quarto.org/)**.<style> img.pvlogo { margin:8px;display:inline;object-fit:scale-down;max-height:50px } </style><divstyle="margin:10px"><ahref="https://panel.holoviz.org"><imgclass="pvlogo"src="assets/logos/panel.png"title="Create interactive components and apps from the PyData ecosystem"></a><ahref="https://hvplot.holoviz.org"><imgclass="pvlogo"src="assets/logos/hvplot.png"title="Quickly create interactive plots from your data"></a><ahref="https://holoviews.org"><imgclass="pvlogo"src="assets/logos/holoviews.png"title="Create complex, interactive plots from your data"></a><ahref="https://geoviews.org"><imgclass="pvlogo"src="assets/logos/geoviews.png"title="Create geopgraphical plots"></a><ahref="https://datashader.org"><imgclass="pvlogo"src="assets/logos/datashader.png"title="Render even the largest datasets"></a><ahref="https://lumen.holoviz.org"><imgclass="pvlogo"src="assets/logos/lumen.png"title="Create data-driven dashboards from yaml specifications"></a><ahref="https://param.holoviz.org"><imgclass="pvlogo"src="assets/logos/param.png"title="Create declarative user-configurable objects"></a><ahref="https://colorcet.holoviz.org"><imgclass="pvlogo"src="assets/logos/colorcet.png"title="Use perceptually uniform colormaps"></a></div>## Embed the HoloViz EcosystemWith [HoloViz](https://holoviz.org/) you get access to a large ecosystem of tools for data visualization.```{python}import panel as pnimport pandas as pdpn.extension(design="material")gis_1880 ='https://earthobservatory.nasa.gov/ContentWOC/images/globaltemp/global_gis_1945-1949.png'gis_2015 ='https://earthobservatory.nasa.gov/ContentWOC/images/globaltemp/global_gis_2015-2019.png'swipe = pn.Swipe(gis_1880, gis_2015, height=450, sizing_mode="stretch_width")pn.Column( pn.chat.ChatMessage("Visualize the global temperature 1945-1949 against 2015-2019", user="User"), pn.chat.ChatMessage(swipe, user="Assistant"),)```For more inspiration check out the [Panel Component Gallery](https://panel.holoviz.org/reference/index.html).## Embed the PyData EcosystemWith the HoloViz ecosystem you can easily **embed the rest of the PyData ecosystem live and interactively inyour documentation**.```{python}import numpy as npimport panel as pnimport matplotlib.pyplot as pltpn.extension(design="material")def plot(factor): r = np.arange(0, 2, 0.01) theta = factor * np.pi * r fig, ax = plt.subplots( subplot_kw = {'projection': 'polar'} ) ax.plot(theta, r) ax.set_rticks([0.5, 1.2, 1.5, 2]) ax.grid(True) plt.close(fig)return figslider = pn.widgets.FloatSlider(value=2, start=1, end=4, step=0.25, name="Factor")plot = pn.pane.Matplotlib(pn.rx(plot)(slider), tight=True, format="svg", height=400, sizing_mode="stretch_width")pn.Column( slider, plot, sizing_mode="stretch_width").embed(max_states=16, max_opts=16)```## Create Beautiful DocumentationThe [HoloViz blog](https://blog.holoviz.org/) is created with the help of [Quarto](https://quarto.org/). Check out the source code [here](https://github.com/holoviz-dev/blog).[](https://blog.holoviz.org/)